Tracy profiler integration
In the previous Tracy profiler setup (submodule approach) post we described Tracy integration with git submodule approach which works fine. Sometimes we do not want to add any submodule dependency to our own repository in which case building Tracy as a standalone library is the way to go.
This post describes Tracy profiler integration into C++ sample project as a standalone (static) library. To get everything working following steps needs to be done
- Step 1 - get Tracy source
- Step 2 - build Tracy (TracyClient) library
- Step 3 - install Tracy library
- Step 4 - write sample program
- Step 5 - write build script for the sample
- Step 5 - build the sample
- Step 6 - capture and view sample trace file
- Issues
TODO: add build capture utility step
TODO: add build profiler (trace file viewer) step
So do not waste any more time and let’s start with the first step
Step 1 - get Tracy source
Download tracy repository with
git clone git@github.com:wolfpld/tracy.git
and switch to v0.9 release with
cd tracy
git switch -c v0.9 v0.9
commands. Check proper branch selected with
$ git log -n1
commit 5a1f5371b792c12aea324213e1dc738b2923ae21 (HEAD -> v0.9, tag: v0.9)
Author: Bartosz Taudul <wolf@nereid.pl>
Date:   Wed Oct 26 22:45:15 2022 +0200

    Release 0.9.0.
command.
Above commands creates tracy directory with Tracy source in it, this way
$ tree -L 1 .
.
└── tracy
Now we have downloaded Tracy source code and can move to the next step.
Step 2 - build Tracy (TracyClient) library
Configure Tracy with
cmake -B build-tracy -S tracy
command from tracy parent directory. By default only TRACY_ENABLE option is set to ON.
Continue building the library with
cmake --build build-tracy -j16
use
--verbosefor verbose build output
command. After build step libTracyClient.a is generated in build-tracy directory. Our directory structure now looks like this way
$ tree -L 1 .
.
├── build-tracy
└── tracy
and we can move to the next step.
Step 3 - install Tracy library
Install Tracy with
sudo cmake --install build-tracy
tip: add
--prefix ~/usr/localto install locally withoutsudo
command, which install Tracy into /usr/local directory (in include/tracy, include/client and lib subdirectories).
Step 4 - write sample program
The next step is to write sample program to test Tracy profiler, I will just borrow the sample from previous post link/to/previous/post there. Create sample directory and save following code as main.cpp
#include <iostream>
#include <tracy/Tracy.hpp>
using std::cout;

void hello() {
	ZoneScopedN("hello");
	cout << "hello!\n";
}

int main([[maybe_unused]] int argc, [[maybe_unused]] char * argv[]) {
	ZoneScoped;
	for (int i = 0; i < 100; ++i)
		hello();

	cout << "done!\n";
	return 0;
}
Step 5 - write build script for the sample
We are going to use CMake as a build tool. Tracy CMake config files were installed in previous install Tracy library step so we can use find_module() function in a build file.
In a sample directory create CMakeList.txt build file this way
cmake_minimum_required(VERSION 3.16)
project(tracy-test CXX)

set(CMAKE_CXX_STANDARD 17)
set(CMAKE_CXX_STANDARD_REQUIRED ON)
set(CMAKE_CXX_EXTENSIONS OFF)

add_compile_options(-Wall -Wextra -O3)

# tracy support
find_package(Tracy REQUIRED)
find_package(Threads REQUIRED) # pthread

option(TRACY_ENABLE "" ON)

# sample
add_executable(main main.cpp)

# link Tracy client
target_link_libraries(main PRIVATE Threads::Threads)
target_link_libraries(main PUBLIC Tracy::TracyClient)
After this step the sample directory looks this way
$ tree sample
sample
├── CMakeLists.txt
└── main.cpp
and we can now continue with next step.
Step 5 - build the sample
With CMake we can configure and build the sample with
cmake -B build-sample -S sample
cmake --build build-sample -j16
commnds.
After this step our directory structure should looks this way
$ tree -L 1 .
.
├── build-sample
├── build-tracy
├── sample
└── tracy
where the sample binary was generated as build-sample/main file.
Step 6 - capture and view sample trace file
To capture Tracy broadcast we need to build capture utility from tracy/capture directory. Please follow building capture utility part of the Tracy profiler setup (submodule approach) post.
To visualize trace file from capture we need to build profiler from tracy/profiler directory. Please follow building profiler part of the Tracy profiler setup (submodule approach) post.
TODO: create standalone sections for building
captureand profiler description …
Now run capture with
$ cd tracy/capture/build/unix
$ ./capture-release -o output.tracy
Connecting to 127.0.0.1:8086...
commands.
Run the sample with
TRACY_NO_EXIT=1 build-sample/main
TODO: I’ve found that sometimes
capturecant establish connection with the sample, that is something required further investigation
which should produce following capture output
$ ./capture-release -o output.tracy -f
Connecting to 127.0.0.1:8086...
Queue delay: 21 ns
Timer resolution: 3 ns
   0.00 Kbps /100.0% =   0.00 Mbps | Tx: 0 bytes | 64 MB | 214.89 ms
Frames: 2
Time span: 215.06 ms
Zones: 101
Elapsed time: 100.24 ms
Saving trace... done!
Trace size 1632 bytes (25.12% ratio)
and save output.tracy trace file on disk.
Now we can run profiler to view trace file output.tracy with
cd tracy/profiler/build/unix/
./Tracy-release
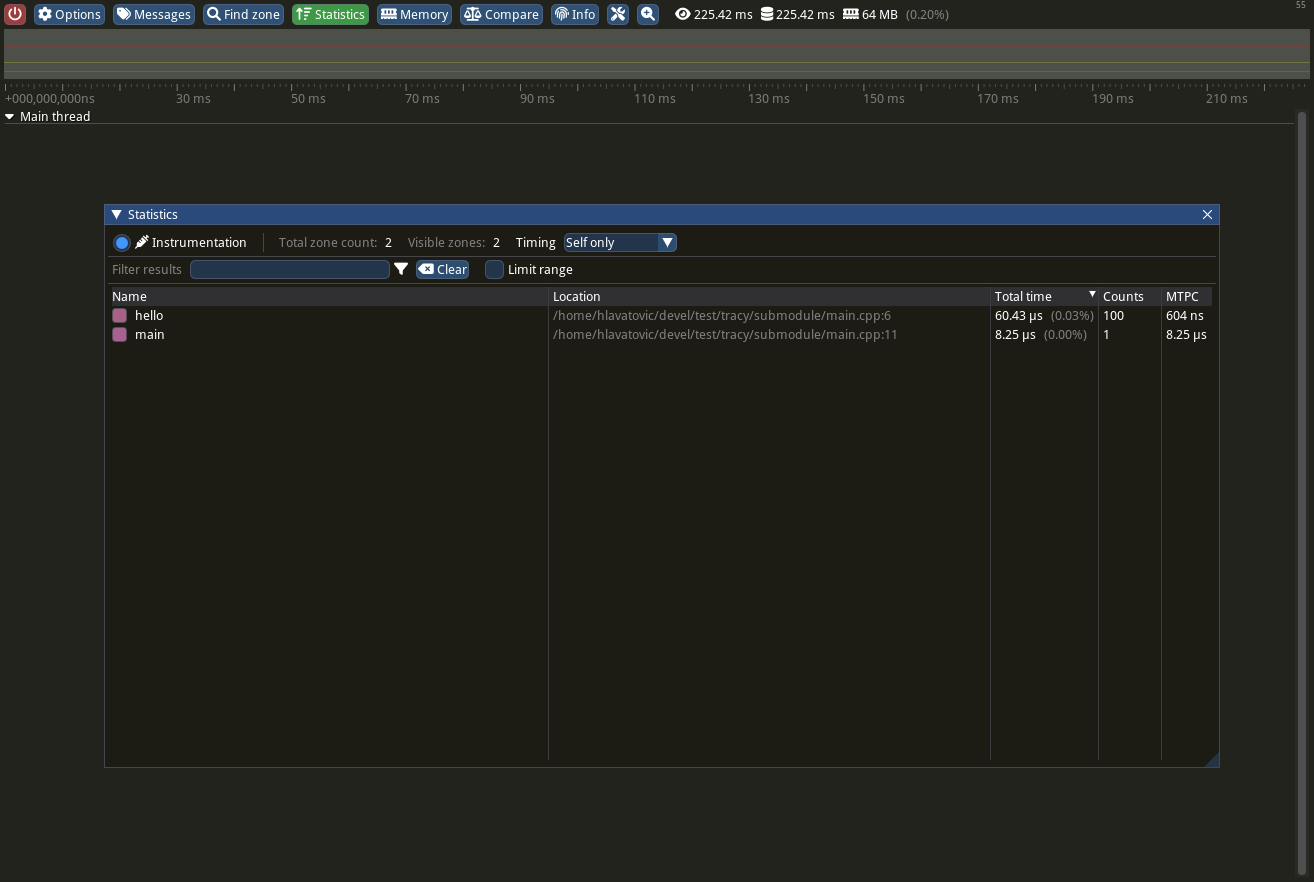
commands. Click to Open saved trace button within profiler GUI and open saved output.tracy file and click to Statistics button. You should see

The sample code is available in github repository.
And that is all today, see you soon.
Issues
- sometimes
capturecant establish connection with the sample, that is something required further investigation …