Tracy profiler setup (submodule approach)
In this post I would like to describe Tracy profiler integration into sample C++ project with submodule approach.
tip: see Tracy introduction video Introduction to the Tracy Profiler to get familiar what is Tracy and how can be used.
First create project directory submodule.
Then the sample project, create main.cp file as
#include <iostream>
#include "tracy/Tracy.hpp"
using std::cout;

void hello() {
	ZoneScopedN("hello");
	cout << "hello!\n";
}

int main([[maybe_unused]] int argc, [[maybe_unused]] char * argv[]) {
	ZoneScoped;
	for (int i = 0; i < 100; ++i)
		hello();

	cout << "done!\n";
	return 0;
}
The sample is straightforward main function calls hello function for 100 times and prints hello! to console. ZoneScoped and ZoneScopedN() macro function calls are there to tell tracy what to profile.
Create CMakeLists.txt build file as
cmake_minimum_required(VERSION 3.16)
project(tracy-test CXX)

set(CMAKE_CXX_STANDARD 17)
set(CMAKE_CXX_STANDARD_REQUIRED ON)
set(CMAKE_CXX_EXTENSIONS OFF)

add_compile_options(-Wall -Wextra)

# tracy support
option(TRACY_ENABLE "" ON)
add_subdirectory(tracy)

# main
add_executable(main main.cpp)

# link Tracy client
target_link_libraries(main PUBLIC Tracy::TracyClient)
Add tracy submodule to the project with
git submodule add https://github.com/wolfpld/tracy
command. This will create tracy directory with tracy source files in our project directory.
TODO: maybe
git initis required before submodule …
Now we can build the sample with (from outside of submodule project directory) with
cmake -B build-submodule -S submodule
cmake --build build-submodule -j16
CMake commands.
Before we can run the sample we need to build capture utility to capture tracy broadcast from the sample application.
The first step is to install capture dependencies with
sudo apt install libglfw3-dev libfreetype-dev libcapstone-dev libdbus-1-dev
note: Ubuntu 22.04 LTS used
command, then go to capture directory and run make this way
cd submodule/tracy/capture/build/unix
make -j16
which produce capture-release binary.
TODO: describe tracy version used (because this will change in the feature)
We also need profiler to visualize captured trace files. So go to profiler directory and run make with
cd submodule/tracy/profiler/build/unix
make -j16
commands which produce Tracy-release binary.
Now we can proceed with the sample, but before that run capture with
cd submodule/tracy/capture/build/unix
$ ./capture-release -o output.tracy
Connecting to 127.0.0.1:8086...
commands. Finally run the sample with
TRACY_NO_EXIT=1 build-submodule/main
command. We should now see following
$ ./capture-release -o output.tracy
Connecting to 127.0.0.1:8086...
Queue delay: 21 ns
Timer resolution: 5 ns
   0.00 Kbps /100.0% =   0.00 Mbps | Tx: 0 bytes | 64 MB | 225.28 ms
Frames: 2
Time span: 225.42 ms
Zones: 101
Elapsed time: 100.11 ms
Saving trace... done!
Trace size 1717 bytes (26.50% ratio)
capture output and also output.tracy trace file was created.
Now to visualise trace file run profiler with
cd submodule/tracy/profiler/build/unix
./Tracy-release
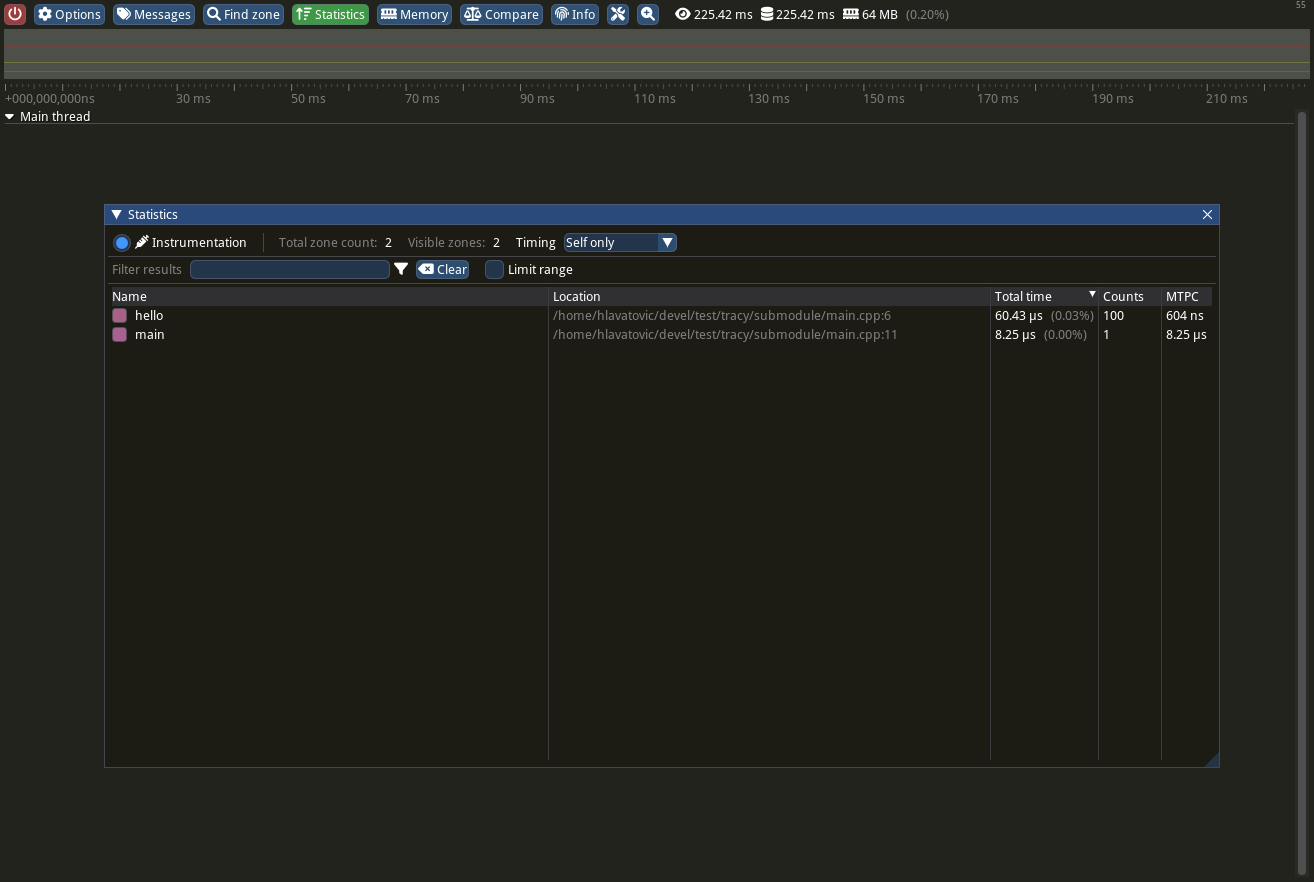
commands, click to Open saved trace button within profiler GUI and open saved output.tracy file. You should see

And that is all today, see you soon.